Surfaces during growth of Galliumarsenide (001)
During growth of
semiconductors there are a lot of other reconstructions appearing, that are
not so well investigated. For MBE growth a phase diagram is shown below
[Däweritz90]:

In MOVPE (or OMVPE, MOCVD or OMCVD) under static (no growth) conditions only
a c(4x4) is observed. During growth this change, depending on temperature
and precursor used.

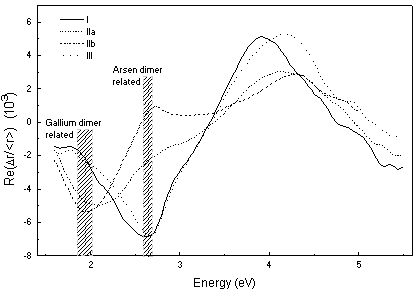
In the above figure typical RAS-spectra observed during growth are shown. In
the mid temperature range, the feature of the gallium dimers are enhanced,
suggesting the surface to become more gallium rich; perhaps by Methyl-induced
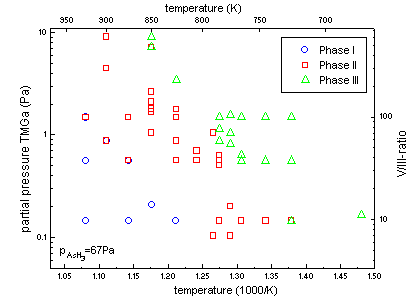
desorption from the incomplete cracking of TMGa. A phase diagram with TMGa and
nitrogen carrier gas is shown below:
[Reinhardt94]

When growing on vicinal surfaces, the border between different "phase spectra"
is not changing [Ploska95]. However the shape
of the spectra typical for these phase are changing.
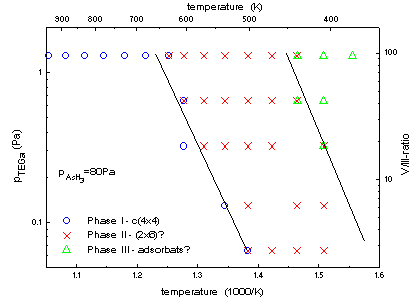
This position of the borders are changing a lot, if TEGa is used as gallium
precursor (here with Hydrogen-carrier). The phase borders are shifting to
lower temperatures:

The real symmetry of these surfaces on a length scale of 20nm or bigger is
supposed to be a (1x2) during growth from GIXS-measurements [Kisker, pers.
comm.].
Any contribution is welcome.
last change: 5.3.1996


